Execute queries in the Neo4j graph database and in Gephi tool perform the operations of loading csv data, running graph statistics scripts and displaying various graphical layouts.
Execute queries in the Neo4j graph database and in Gephi tool perform the operations of loading csv data, running graph statistics scripts and displaying various graphical layouts.
What is Neo4j?
Neo4j is a native graph database, built from the ground up to leverage not only data but also data relationships. Neo4j connects data as it’s stored, enabling queries never before imagined, at speeds never thought possible.
Neo4j is an open-source, NoSQL, native graph database that provides an ACID-compliant
transactional backend for your applications. Neo4j is referred to as a native graph database
because it efficiently implements the property graph model down to the storage level. This
means that the data is stored exactly as you whiteboard it, and the database uses pointers to
navigate and traverse the graph. In contrast to graph processing or in-memory libraries, Neo4j
also provides full database characteristics, including ACID transaction compliance, cluster
support, and runtime failover - making it suitable to use graphs for data in production
scenarios.
What is a Graph Database?
A graph database is a database that uses graph structures for semantic queries with nodes,
edges, and properties to represent and store data. A key concept of the system is the graph. The
graph relates the data items in the store to a collection of nodes and edges, the edges
representing the relationships between the nodes. The relationships allow data in the store to be
linked together directly and, in many cases, retrieved with one operation. Graph databases hold
the relationships between data as a priority.
Working with NEO4J:
Create project:

Model Description:

About Dataset used:

Creating node:
CREATE (accountHolder1:AccountHolder {
FirstName: "Arjun",
LastName: "Rupavatia",
UniqueId: "ArjunRupavatia" })
CREATE (accountHolder2:AccountHolder {
FirstName: "17IT098",
LastName: "17IT098",
UniqueId: "17IT098" })
Creating another node and adding relationship.
CREATE (accountHolder1:AccountHolder {
FirstName: "ARJUN",
LastName: "RUPAVATIA",
UniqueId: "ArjunRupavatia" })
CREATE (accountHolder2:AccountHolder {
FirstName: "17IT098",
LastName: "17IT098",
UniqueId: "17IT098" })
CREATE (address1:Address {
Street: "123",
City: "Rajkot",
State: "Gujarat",
ZipCode: "360001" })
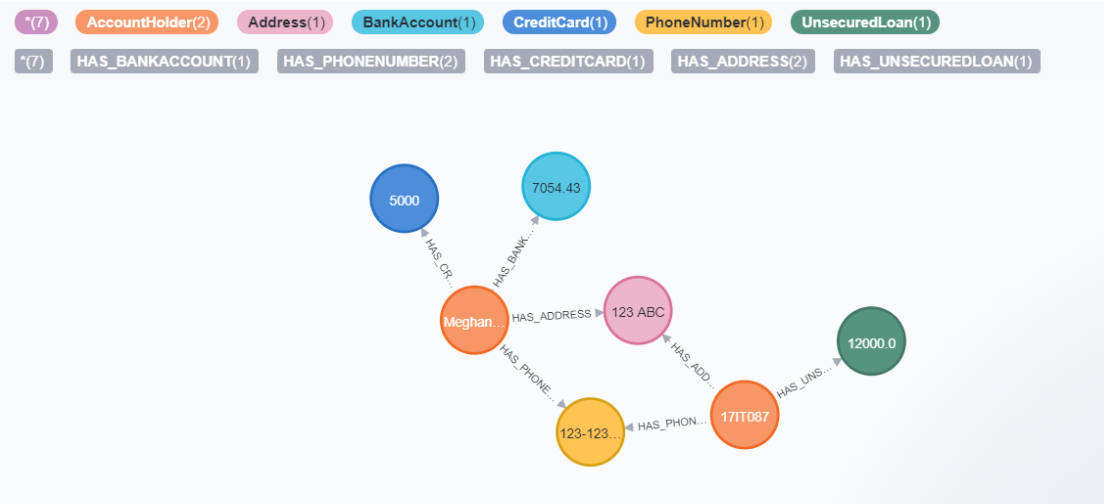
Adding more Attributes(nodes) and relationship
CREATE (accountHolder1:AccountHolder {
FirstName: "Arjun",
LastName: "Rupavatia",
UniqueId: "ArjunRupavatia" })
CREATE (accountHolder2:AccountHolder {
FirstName: "17IT098",
LastName: "17IT098",
UniqueId: "17IT098" })
CREATE (address1:Address {
Street: "123 ABC",
City: "Ahmedabad",
State: "Gujarat",
ZipCode: "380015" })
CREATE (accountHolder1)-[:HAS_ADDRESS]->(address1),
(accountHolder2)-[:HAS_ADDRESS]->(address1)
CREATE (phoneNumber1:PhoneNumber { PhoneNumber: "123-123-1234" })
CREATE (accountHolder1)-[:HAS_PHONENUMBER]->(phoneNumber1),
(accountHolder2)-[:HAS_PHONENUMBER]->(phoneNumber1)
CREATE (creditCard1:CreditCard {
AccountNumber: "1234567890123456",
Limit: 5000, Balance: 1442.23,
ExpirationDate: "01-20",
SecurityCode: "123" })<-[:HAS_CREDITCARD]-(accountHolder1)
// Create Bank Account and connect 1 account holder
CREATE (bankAccount1:BankAccount {
AccountNumber: "2345678901234567",
Balance: 7054.43 })<-[:HAS_BANKACCOUNT]-(accountHolder1)
CREATE (unsecuredLoan2:UnsecuredLoan {
AccountNumber: "4567890123456789-0",
Balance: 9045.53,
APR: .0541,
LoanAmount: 12000.00 })<-[:HAS_UNSECUREDLOAN]-(accountHolder2)
Return *
GEPHI:-
Dataset Description:
Which Olympic athletes have the most gold medals? Which countries are they from and how has it changed over time?
More than 35,000 medals have been awarded at the Olympics since 1896. The first two Olympiads awarded silver medals and an olive wreath for the winner, and the IOC retrospectively awarded gold, silver, and bronze to athletes based on their rankings. This dataset includes a row for every Olympic athlete that has won a medal since the first games.
Lets Explore the tool:

To import data select "Import Spreadsheet " and click finish
Graph will be generated:

How to analyze graph data with different visualization technique?
Here We can change layout from the left panel as well as we can add filters from right side
panel, drag the appropriate filter from above panel to below panel on right side.
Types of layout in gephi tool:
- Introduction
- Run
- Choice
- ForceAtlas
- Fruchterman-Reingold
- YifanHu Multilevel
- OpenOrd
- ForceAtlas 2
- Circular Layout
- Radial Axis Layout
- Geographic map
- Node overlapping
- Geometric transform
We can have various Layout:

Comments
Post a Comment