Visual Programming with Orange Tool.
Visual Programming with Orange Tool.
Visual programming is implemented through an interface in which workflows are created by linking predefined or user-designed widgets, while advanced users can use Orange as a Python library for data manipulation and widget alteration.
How to Split our data in training data and testing data in Orange?
For splitting our data, which we may require in dividing the datasets in training and testing phase, can be easily achieved in orange tool by widgets like "Data Sampler", Data Sampler takes input from file widget and provides various options for splitting our data
Data Sampler
- Data: input dataset
- Data Sample: sampled data instances
- Remaining Data: out-of-sample data

- Information on the input and output dataset.
- The desired sampling method:
- Fixed proportion of data returns a chosen percentage of the entire data (e.g. 70% of all the data)
- Fixed sample size returns a selected number of data instances with a chance to set Sample with replacement, which always samples from the entire dataset .
- Cross Validation partitions data instances into the specified number of complementary subsets. Following a typical validation schema, all subsets except the one selected by the user are output as Data Sample, and the selected subset goes to Remaining Data. (Note: In older versions, the outputs were swapped. If the widget is loaded from an older workflow, it switches to compatibility mode.)
- Bootstrap infers the sample from the population statistic.
- Press Sample Data to output the data sample.
Example
- Fixed Sample Size
- First, let’s see how the Data Sampler works. We will use the Insurance dataset from the File widget.
- We sampled the data with the Data Sampler widget
- We chose to go with a fixed sample size of 5 instances.
- We can observe the sampled data in the Data Table widget.
- The second Data Table(out of sample) shows the remaining instances that weren’t in the sample. To output the out-of-sample data, double-click the connection between the widgets and rewire the output to Remaining Data –> Data.


Fixed Sample Size(Split into Train and Test)
- Now, we will use the Data Sampler to split the data into training and testing part. We are using the Insurance dataset , which we loaded with the File widget.
- In Data Sampler, we split the data with Fixed proportion of data, keeping 70% of data instances in the sample.
- Then we connected one output contain 70% data to the Test and Score and the remaining data output to the Test & Score widget, Data Sample –> Data and Remaining Data –> Test and score. And then we add Logistic Regression as a learner, Logistic Regression –> Test and score. This runs logistic regression on the Data input and evaluates the results on the Test Data.


Cross Validation
- Now, we will use the Data Sampler to split the data into training and testing part. We are using the Insurance dataset, which we loaded with the File widget.
- In Data Sampler, we split the data with cross validation, keeping 3 used subset in the sample.
- Then we connected Data sampler –> Test and score. And then we add Logistic Regression as a learner, Logistic Regression–> Test and score.
- As our data set is small we need to reduce the number of folds, it depends on the size of the dataset.

What is the effect of splitting data on classification result/ classification model?
Splitting the dataset in different ways during testing and training phase can sometimes have major effect in accuracy of classification model.
Lets take different divisions of data and if it has any effect on our classification model'


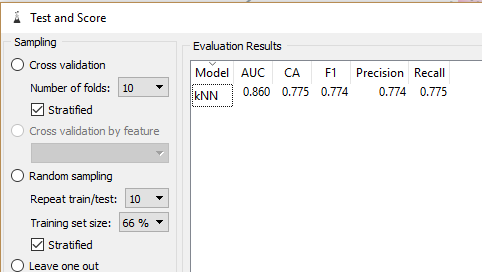
Accuracy became 77%
Still, this is not optimum, we can still manipulate the sampling parameters and can achieve better accuracy.
How to efficiently use cross-validation in Orange? What is the effect of it on model output/accuracy?
While Training a Machine Learning model, the problem of over-fitting and under-fitting is very common. over fitting
Overfit Model: Overfitting occurs when a statistical model or machine learning algorithm captures the noise of the data. Intuitively, overfitting occurs when the model or the algorithm fits the data too well. Overfitting a model result in good accuracy for training data set but poor results on new data sets. Such a model is not of any use in the real world as it is not able to predict outcomes for new cases.
Underfit Model: Underfitting occurs when a statistical model or machine learning algorithm cannot capture the underlying trend of the data. Intuitively, underfitting occurs when the model or the algorithm does not fit the data well enough. Underfitting is often a result of an excessively simple model. By simple we mean that the missing data is not handled properly, no outlier treatment, removing of irrelevant features or features which do not contribute much to the predictor variable.
Overfitting can be resolved by using techniques like Cross-Validation.
Basic idea of Cross-Validation is:
• To partition the data into a number of subsets
• Hold out a set at a time and train the model on remaining set
• Test model on hold out set
Types of Cross-Validation:
•K-Fold Cross Validation
•Stratified K-fold Cross Validation
•Leave One Out Cross Validation
Let’s understand each type one by one
How to decide the value of k?
The value for k is chosen such that each train/test group of data samples is large enough to be statistically representative of the broader dataset.
A value of k=10 is very common in the field of applied machine learning, and is recommend if you are struggling to choose a value for your dataset.
If a value for k is chosen that does not evenly split the data sample, then one group will contain a remainder of the examples. It is preferable to split the data sample into k groups with the same number of samples, such that the sample of model skill scores are all equivalent.
Lets apply different cross validation techniques on our Orange model:


Here, we only changed the value of K in K-fold-cross-validation and there was a noticeable difference in the accuracy. So, we must find the optimal technique and optimal parameter of that technique in order to generate maximum accuracy.
Comments
Post a Comment